Run Observability now available for OpenTofu Native Stacks!
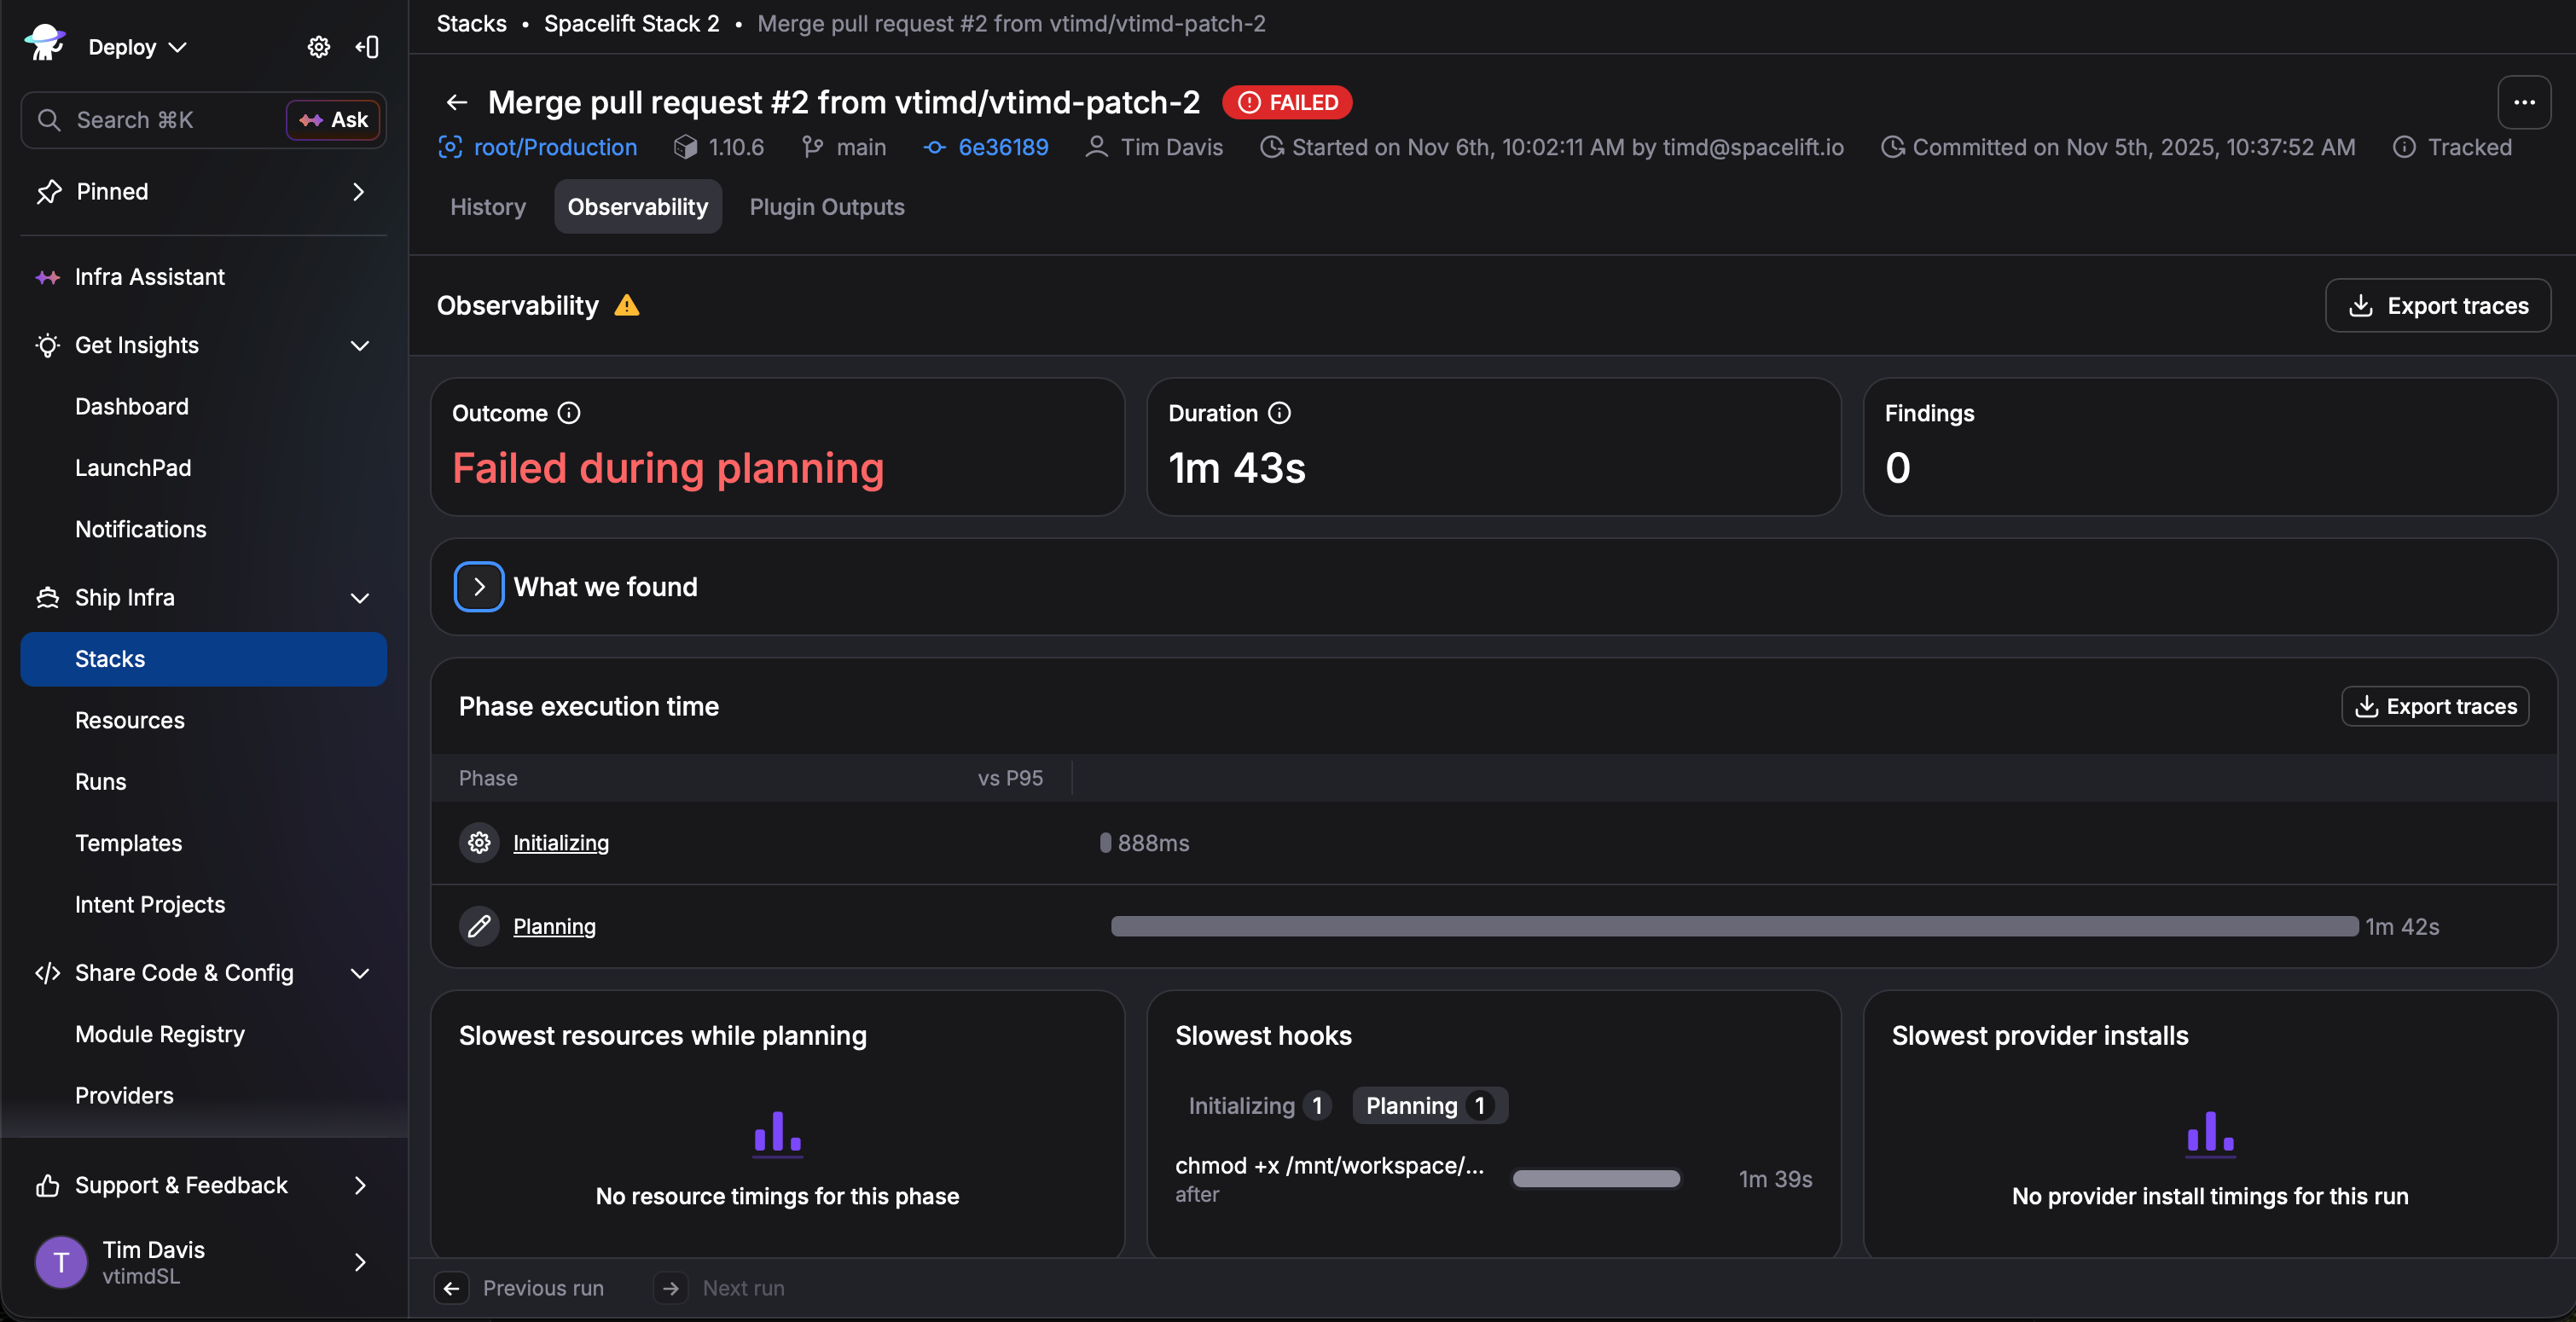
Every run on an OpenTofu native stack now has an Observability tab that shows why the run was slow or failed, and what to fix. Spacelift Run Observability reads the OpenTelemetry spans OpenTofu emits during init, plan, and apply. The Spacelift worker assembles those spans into a single trace per run, and Spacelift evaluates that trace against a set of rules and the stack’s run history to produce findings.
What’s on the Observability tab
Get findings with a fix: natural language explanations for slow or failed runs, generated from rules, with a suggested fix for each.
Break down every run by phase: time spent in init, plan, and apply, with outliers called out.
Spot the slowest resources: the resources that took the most time in each phase, listed by address.
Catch slow provider installs: download and install time per provider, with a finding that points private worker users to a provider plugin cache.
Jump to the real error: the failing phase and the error message pulled from the trace, so you don’t need a
TF_LOG=DEBUGre-run.Track runs against your baseline: every run compared against the stack’s typical run time, so regressions stand out.
Setup
There’s nothing to configure. The worker collects spans automatically, so you don’t need to run an OpenTelemetry collector or an observability backend.
Availability
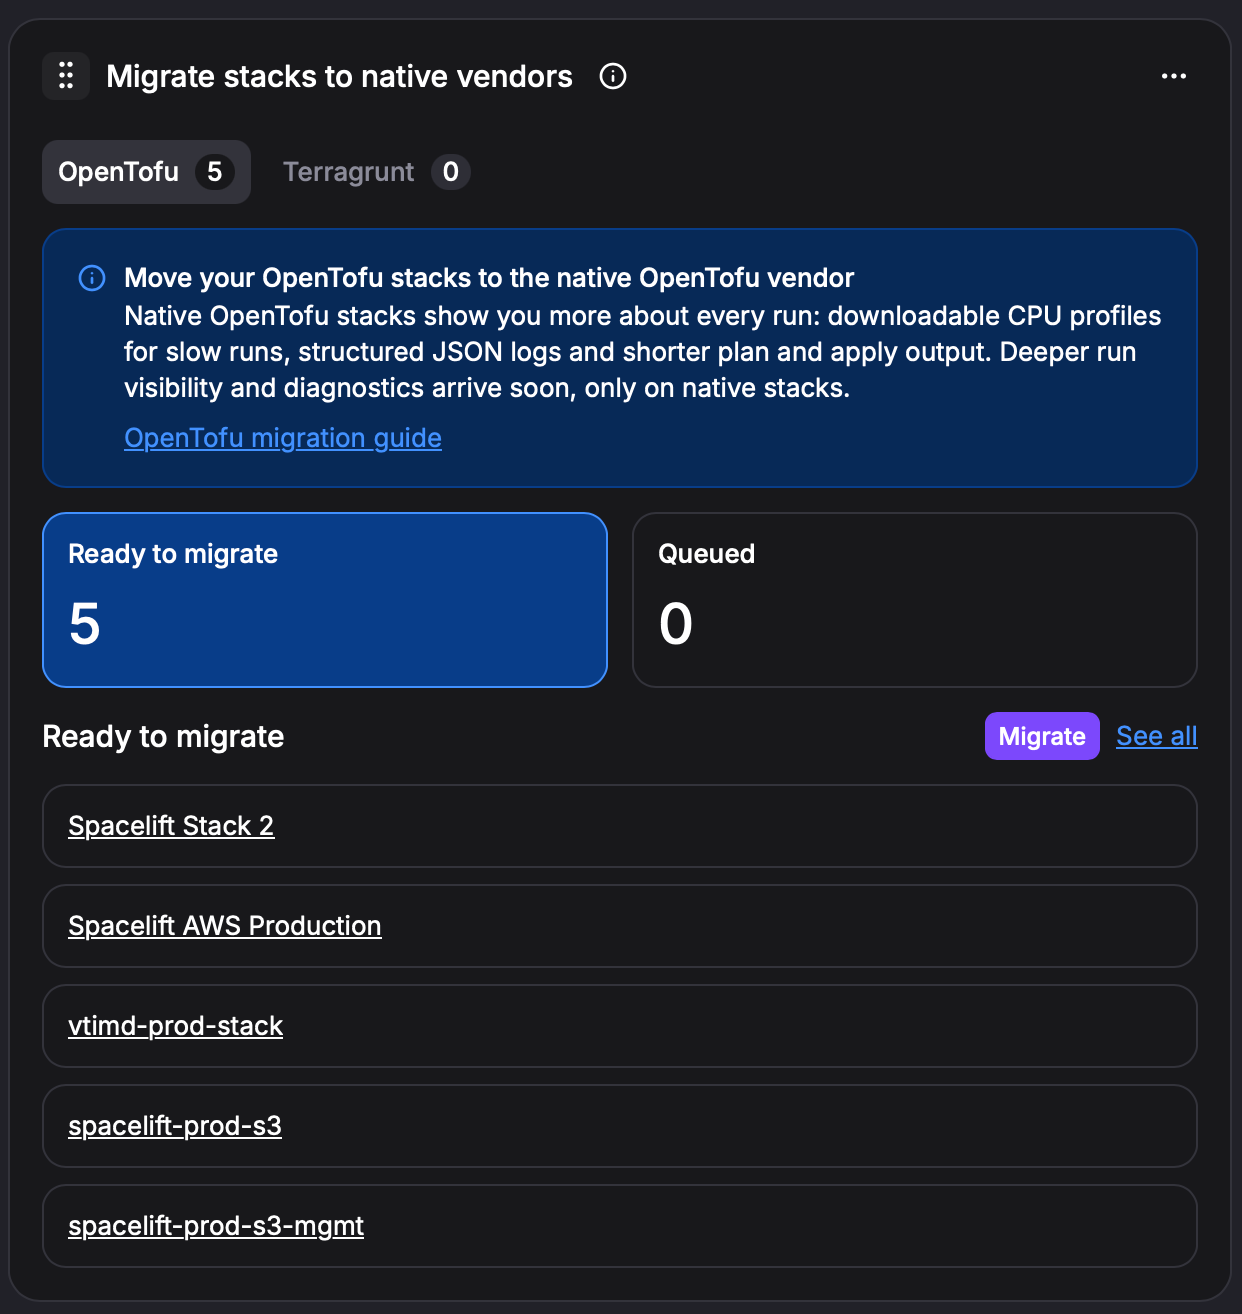
Run Observability is generally available on OpenTofu native stacks. Terraform stacks don’t get findings, because Terraform doesn’t expose provider install or per-resource timing. If you run Terraform stacks on OpenTofu, migrate them to OpenTofu native stacks to get every finding.
Read the blog and join the OpenTofu Observability webinar on November 19 for a live walkthrough.